The photo electric effect is a phenomenon in which electrons eject from the metarial surface when light falls on it. The electrons which emitted in this process are photoelectrons. For the photoelectric emission process alkali metals are generally use. These are lithium, sodium, poatassium, rubidium and cesium, that shows photo electric effect with visible light.
Thank you for reading this post, don't forget to subscribe!Photo electric effect experiment:
To understand the photo electric effect many physicist did work hard. As you know it was first observed by the Hertz in 1887. It was a sudden observation by the Hertz, he noticed when ultraviolet rays made to fall on the cathode plate (connect with negative terminal of the battery) in the electric discharge tube, a current flows. Later Hallwaches did try and confirmed the same with zinc plates. But what was the point that he noticed?
He observed when light falls on the negative plate only then current flows. If light falls on the positive plate no current flows [here, galvanometer is used to observe the current direction, its deflection indicate the current direction].
Read Also: Frank-Hertz Experiment Viva
This was the time when thermodynamics, optics, classical mechanics and electrodynamics has been established. And people were thinking with the available information. So it couldn’t studied next ten years. Later J J Thomson, Lenard, Millikan and Einstein studies reach on final conclusion. Also, the idea coined of discrete energy after this experiment. Which later contribute in the origin of the quantum mechanics.
Below you can see it with the help of PhET Simulations. To observe exactly what happens in this experiment, when you change the wavelength from UV to visible and then infra red region.

| Click to Run |
In the photo electric experiment what are important factors that decide the current? These are;
#1. Intensity of the color (a particular wavelength), check it by varying the intensity mode.
#2. battery potential difference and polarity
What we measure in this experiment? we measure current and its direction to judge that electrons travel from cathode plate to the anode plate in the electric discharge tube. Also, the effect of light intensity and applied battery voltage to the current.
What we will understand from this experiment? This experiment as I told you in the begining is one of the foundation experiments that significantly open the door of microscopic world i.e. quantum world.
What are the basic components of the photoelectric experiment? It consists two metallic plates named as P1 and P2; plate P1 is negative plate on which light incidents and connected with negative terminal of the battery.
Some specifications about the experiment are;
- Negative plate
- Lamp is a source of light, the light (photons, are discrete energy packets)
- Emitted electrons, when light falls on the metalic surface with specific intensity.
- This UV (ultra violet) region of wavelength
- The visible spectrum
- The infra red region of light
- Intensity of light can be controlled by the slider from 0 to 100%.
- A variable battery
- A positive plate
- Target- different metals
Experiment 1.
Study the variation of the photoelectric current with intensity
For it keep the slider on a particular point of frequency (wavelength) this may be UV, visible and/or infra red region. For it from the target section select a target source and note the reading of ameter and voltmeter.
Targets which are available in this simulation are;
- Sodium
- Zinc
- Copper
- Platinum
- Calcium
Range of the spectrum starts from Ultra Violet region to the Infra red region. The visible region (seven colors) lies in between these two.
So what you have to do just select the target, fix the wavelength and change the intensity of it. From the options button (in menu) click on “show photons”. By this way you can see light as a photon and an emission of electron as a result of it.
Initially when intensity of light is 2% and wavelength 100nm (UV region), source is sodium, voltage is zero and current 0.021A. I think it will be better if I can put all the data in a tabular form.
Table for the photo electric current with intensity of light:
| Target | Wavelength | Intensity in percentage | Current in mA | Voltage in volts | Remarks |
| Sodium | 100nm | 2 | 0.021 | 0 | Here you can see that irrespective to the zero voltage current is increasing linearly with the increasing in intensity. |
| 10 | 0.085 | 0 | |||
| 20 | 0.173 | 0 | |||
| 30 | 0.261 | 0 | |||
| 50 | 0.438 | 0 | |||
| 80 | 0.709 | 0 | |||
| 100 | 0.882 | 0 |
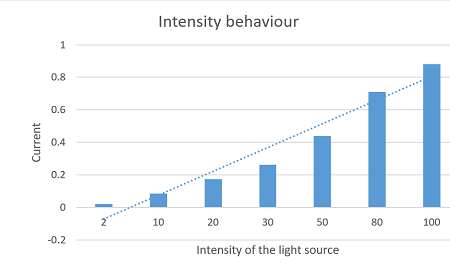
In this observation we have consider the Ultra Violet (UV) region for the light source and target is sodium. In the above picture as we are increasing the intensity of light, the photoelectric current also increasing. Now, we will take different light source, and will fix the non zero potential, let see what are the results?
| Target | Wavelength | Intensity in percentage | Current in mA | Voltage in volts | Remarks |
| Sodium | 395nm Violet Color | 2 | 0.000 | +3.00 | Here you can see that at nonzero positive potential in the visible spectrum, only sodium emits the electron but the magnitude of current is lower than the Ultra Violet (UV) light. |
| 10 | 0.016 | +3.00 | |||
| 20 | 0.030 | +3.00 | |||
| 30 | 0.047 | +3.00 | |||
| 50 | 0.076 | +3.00 | |||
| 80 | 0.123 | +3.00 | |||
| 100 | 0.153 | +3.00 |
In this observation, we have seen that current increases with respect to the intensity of the light source, irrespective to the applied positive potential on the positive plate. Also, the magnitude of the current for the visible light source is less than the Ultra Violet (UV) light source at similar intensities. Only first three color give response in the VIBGOYR for this effect. While no observation seen for other targets with these light sources.
When Infra red region is selected no current is observed as a result of different intensity of the light source. Here, I have used all targets mentioned above. So what we can conclude from these observations?
- Ultra Violet light source have more energy compared to the Visible light source.
- No emission of electrons from the targets as a result of Infra red sources at different intensities.
- Current is directly proportional to the intensity of light irrespective to the applied voltage.
In reference to the point 3, I want to clear that each light source is a photons producer. These photons are responsible for the light, known as energy packet. When we increase the intensity, actually we increase the number of photons. Each emitted electrons from the metal surface is the result of interaction of this photon with the surface atom. So, when one is increasing the intensity of light number of more electrons are emitting and that is why current increases.
In the next experiment we will study the behaviour of photoelectric current with applied voltage, keeping the intensity constant.
Experiment-2
Variation of Photoelectric current with the applied voltage
In this experiment, the intensity of light source is fix and selected a wavelength in the Ultra Violet region (235 nm) so that photoelectric current flows. Now we will vary the voltage from -8 volts to the +8 volts and then observation of the photoelectric current. To study this behaviour again I will create a table to show it clearly.
| Source | Intensity | Wavelength | Volts | Current |
| Sodium | 22% | 235nm | -8.00 | 0.000 |
| -7.80 | 0.000 | |||
| -7.00 | 0.000 | |||
| -6.20 | 0.000 | |||
| -5.20 | 0.000 | |||
| -4.40 | 0.000 | |||
| -3.20 | 0.000 | |||
| -2.20 | 0.065 | |||
| -1.80 | 0.099 | |||
| -1.20 | 0.149 | |||
| -0.80 | 0.183 | |||
| -0.40 | 0.217 | |||
| 0.60 | 0.250 | |||
| 1.20 | 0.250 | |||
| 1.80 | 0.250 | |||
| 2.20 | 0.250 | |||
| 3.20 | 0.250 | |||
| 4.20 | 0.250 | |||
| 6.40 | 0.250 | |||
| 7.60 | 0.250 | |||
| 8.00 | 0.250 |
Remarks: This observation is taken at the constant intensity. If intensity will increase or decrease in same ratio the current will increase or decerease. Here you can see that current flows at a specific minimum voltage difference.
In this experiment, only one intensity is taken but from the last experiment we knows that current is directly proportional to the intensity. If intensity of the light sources will increases, the photoelectric current will also increases in the same proportion.
So, from the above observation we can say that when we give positive potential to the target plate then electrons emits no doubt, but they are not able to reach at the positive plate because of the repulsive force. What is it means? See, target plate emits the electron, if the electrons don’t reaches at the second plate then there will be no current in the circuit. But if these photoelectrons reache at the positive plate then current flows in the circuit. In the discharge tube electrons flow through the vaccum.
You might be thinking that if we have selected the frequency of the light that is capable to emits the electron, then why don’t current flows? It’s answer also hidden in the above paragaph. Do you know where? Yes! when we give the positive potential to the target plate, then all the emitted electrons attract towards the same plate.
At this position I have a question for you. Does these emitted electrons will have energy to move upto some distance from the target? And next question, does all the electrons have same emission energy? This question can be asked in this way. Does all electons move with same speed in the discharge tube after emission? Is it possible to be fastest and slowest electrons inside the discharge tube?
Right, now you just think about it, till that I just interpret the data in terms about the stopping potential or the cut off potential. What is the stopping potential in this experiment? To understand it we have to plot a graph with current and voltage for different intensities of a light source. This graph shows that, for all intensities there is a common potential value, at which current becomes zero. This potential at which no current flows in the circuit known as stopping potential or cut off potential.
So stoping potential is a minimum potential below which no photoelectric current exist. This stopping potential is different for different target materials and not depends on the intensity of the incident light. How to understand this concept, that it doesn’t depends on the intensity of incident light?
Remember this stoping potential is the potential that you applied in between the plates. So any electron which lies in between the plates this potential will effect their movement. To understand it better you have to see two concept here;
-
Emitted electrons have kinetic energy
-
These photoelectron lie in between the plates on which we have applied the potential
See, light is nothing but having a group of photons that strikes on the metal surface and as a result electrons emit. Each photon helps to eject an electron. When this photon strike on the surface it lose some energy to remove this electron from the surface and rest of the enrgy transfered in terms to the kinetic energy. So emitted electrons moves with different velocities in electric discharge tube. There will be a minimum and a maximum velocity. Let we consider vmax is the velocity of the fastest electrons. So, the kinetic energy of these fastest electrons will be or can be written as;
—-(1)
This is the kinetic energy of the fastest electrons that is not sufficient to reach at the anode plate. What is that factor which stops these electrons to reach at this plate? This is potential at which no current flows in the circuit irrespective to any value of the intensity of light. So this potential stop these higher energy electrons, below that no possibility of current.
Here, I want to add one more concept, and probably that will be clear to you is for the acclerated electrons in the electric discharge tube. That kinetic energy is defined by the eV. This is actually work done by the battery to accelerate the electron, where “V” is the potential difference and “e” is the electronic charge.
In the same sense, here we have observed in this experiment that photoelectrons don’t reach at the anode plate below this potential. It means this eV0 is used to stop the kinetic energy of the fastest electrons in the electric discharge tube. This is possible only when this work done on the electron becomes eqal to their emitted energy. This can be written mathematically;
—–(2)
In the above equation “e” and “m” are the electon charge and mass respectively, both are constants. Stopping potential V0 depends on the maximum velocity of the electrons. These are the only two variables, it may vary from metal to the metal. So, you can say that stoping potential is independent from the intensity of incident light.
Photo electric effect Experiment-3
To study the variation of stopping potential with frequency:
In this experiment we choose a particular color (specific wavelength) and observe the variation of voltage at which current becomes zero. We note down that voltage and again use other source of light (specific wavelength), repeat the same procedure. By this way we observe the specific wavelength and corresponding value of the stoping potential.
After this observation, we plot stopping potential and frequency graph. In this graph we observe that it reach at a certain minimum value of the frequency. This minimum frequency at which we observe the stoping potential is zero known as thrshold frequency or cut off frequency. From the graph, if one observe it is very clear that stopping potential increases lineraly with the frequency.
Conclusion:
- Photoelectric effect equation is discussed
- Photoelectric effect experiment and its different components
- Photoelectric effect definition and related terms
- The photoelectric effect
- Einstein photoelectric effect and its significance